Supply chain leaders tracking container volumes in 2026 are watching a story that the headlines are missing. Yes, tariffs have disrupted the transpacific. Yes, the Red Sea remains effectively closed. But underneath all of that, Asian container exports are flowing into a significantly broader set of markets than most shippers realize, and that diversification is creating real opportunity for businesses that can navigate the new map.
In this episode of The Freight Buyers’ Club, host Mike King spoke with Nigel Pusey, CEO of Container Trade Statistics (CTS), which tracks global container volumes directly from shipping line manifests covering approximately 70–75% of all global TEU movements.
The data suggests these trade patterns have been developing for years, not just in response to today’s tariff environment.
Global Container Volume: Resilience Beneath the Disruption
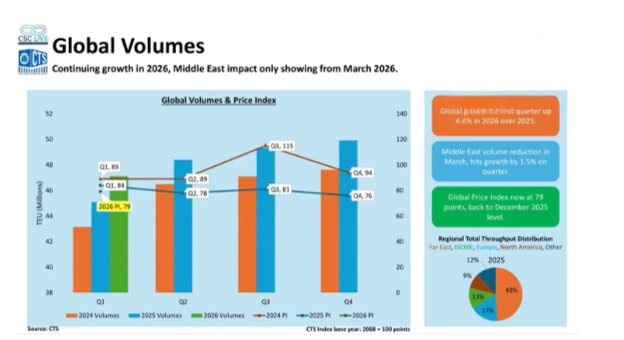
Despite one of the most disruptive starts to a year in recent memory, including US tariff rulings, the Strait of Hormuz closure, Iranian port blockages, and continued Cape of Good Hope routing,Q1 2026 global container volumes reached 47.2 million TEU, up approximately 4.4% year on year.
Nigel noted this would have been closer to 6% growth were it not for the March Middle East shock, which removed an estimated 840,000 TEU from global volumes in a single month.
He described the first quarter as a continuation of the growth trends seen in 2024 and 2025.
The Structural Shift: Three Trade Policy Cycles in the Making
The headline number on Far East to North America is not surprising. Volumes were down 4% in 2025 versus the prior year, reversing a 15% increase the year before.
Greater China to the US dropped around 10% year on year, or roughly 1.8 million TEU. That cargo has not disappeared. It has been redirected
What the CTS data shows is that this is not a short-term reaction to a single tariff announcement. Nigel described it as a strategic, multi-year decision by Chinese exporters to find more stable markets, one that pre-dates the current US administration and is now structurally embedded.
As he put it: once you are three years into a trade shift, you do not reverse it lightly.
Three Growth Markets Worth Watching
Sub-Saharan Africa up 33% year on year in Q1Asia to Sub-Saharan Africa imports rose 33% in Q1 2026, driven primarily by Chinese exports into West Africa.
The growth is backed by real infrastructure investment, including major port upgrades in Lagos, new rail projects across the region, and the arrival of 20,000 TEU vessels at terminals that could not have handled them five years ago.
Exports out of the region are beginning to grow as well.
Nigel sees this as investment-led growth that is unlikely to reverse unless oil prices significantly dampen consumer demand across Nigeria and the wider region.
South and Central America up 17%
Growth is concentrated on the East Coast, primarily Brazil. This trade is more consumer-driven than Africa — rising GDP, access to competitively priced Chinese and Southeast Asian goods, and expanding middle class demand. Similar percentage growth was recorded across all of 2025 versus 2024.
India up 17%
India’s growth has been consistent , with similar figures seen since Q3/Q4 2024. Like South America, this is driven by economic expansion and growing domestic demand. India has become a key destination for manufacturers and exporters looking beyond traditional sourcing markets.
Southeast Asia Gains Share
Within the transpacific trade, the origin mix has shifted decisively. Southeast Asia to US volumes rose by approximately one million TEU as China volumes declined.
Vietnam accounts for roughly 50% of that Southeast Asian gain. Thailand is in second place at around a third. Cambodia contributes 10–15%, with smaller but meaningful gains elsewhere.
According to Nigel, this is the China+1 strategy made visible in cargo data. Manufacturing investment placed over two to three years does not get reversed quickly, especially when it has taken three presidential cycles of US trade policy in the same direction to create it.
Europe Trade is Strong, but Imbalances are Growing
Far East to Europe volumes grew 9% in 2025 and were up approximately 15% year on year in Q1 2026. Nigel cautioned that some of this reflects pull-forward ahead of tariff uncertainty and a favorable comparison base from early 2025 when the Gemini alliance reorganization softened volumes.
The widening imbalance between eastbound and westbound trade is another trend to watch. The Far East to Europe head-haul to back-haul ratio has widened from 2.4:1 in 2023 to 3.5:1 in 2026 — a 45.8% increase in imbalance in just three years.
By March 2026, only 34% of available Europe-to-Far-East capacity was filled with actual cargo.
Nigel linked the imbalance to declining German export volumes.
It is a trend that carriers, shippers, and logistics providers operating on Europe lanes will need to watch carefully.
What This Means for Shippers
The trade map has changed. The US remains a critical market, but it is no longer the automatic default for Asian export capacity.
Container volumes are diversifying into Africa, South America, and Southeast Asia, creating opportunities as well as new operational challenges.
Success in these markets often depends on local knowledge, partner networks on the ground, and an understanding of regional compliance requirements. Get in touch with a Dimerco specialist to discuss how these shifts may affect your supply chain.
These are the kinds of structural shifts explored in depth on the Freight Buyers’ Club. Subscribe for regular insights from global trade and logistics leaders to stay informed as market conditions evolve.
